
The Dow Jones Industrial Average (DJIA) is more than just a number on a ticker tape; it is a psychological barometer for the American economy and a cornerstone of global financial markets. Investors, analysts, and casual observers alike often ask, “What was the highest Dow Jones?” to gauge the current health of the market relative to its peak performance. As of late 2024, the Dow Jones reached a historic milestone, consistently pushing past the 41,000-point threshold, marking a remarkable journey from its humble beginnings in the late 19th century.
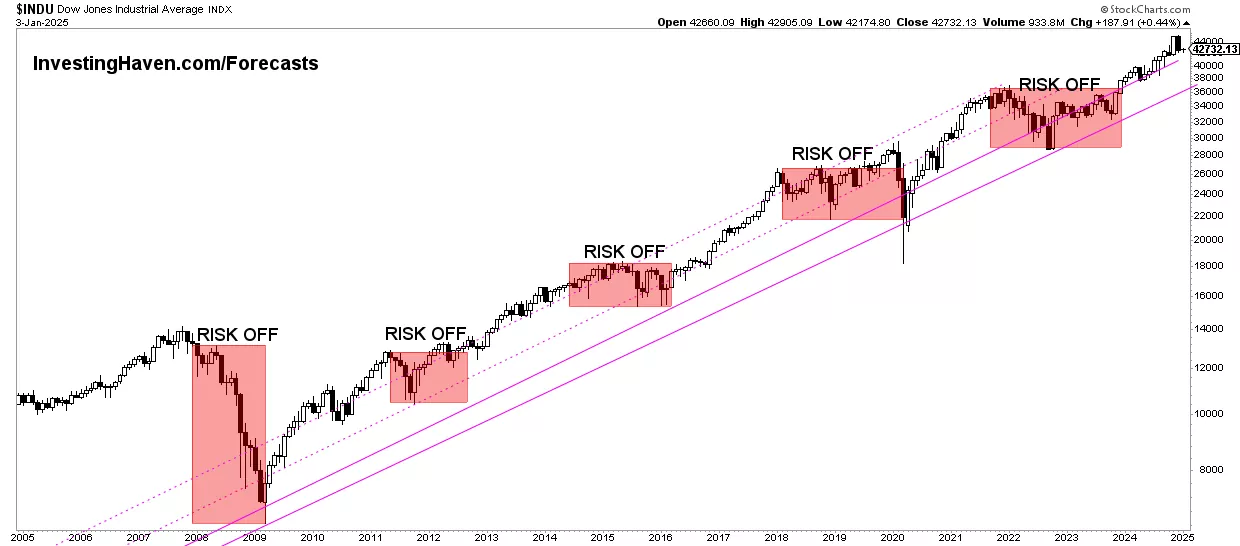
Understanding the “highest” point of the Dow requires more than just looking at a single figure. It involves analyzing the economic conditions, corporate earnings, and monetary policies that propel the index to new heights. For the modern investor, these peaks are not just records to be broken; they are signals of underlying market strength and potential indicators of future volatility.
Understanding the All-Time Highs of the Dow Jones Industrial Average
The Dow Jones Industrial Average is a price-weighted index of 30 prominent companies listed on stock exchanges in the United States. Because it is price-weighted, companies with higher share prices have a greater impact on the index’s total value than those with lower share prices. This unique structure means that when we discuss the “highest” Dow, we are looking at the aggregate performance of some of the most influential blue-chip companies in the world, including giants like UnitedHealth Group, Goldman Sachs, and Microsoft.
The Historic Breakthrough of 40,000 and 41,000
In May 2024, the Dow Jones Industrial Average made headlines globally by crossing the 40,000-point mark for the first time in its 128-year history. This achievement was not merely a round number; it represented a massive recovery from the depths of the 2022 bear market and the 2020 pandemic-induced crash. Following this milestone, the index continued its upward trajectory, hitting various intraday and closing highs above 41,000 throughout the third quarter of 2024.
The climb to these record levels was driven by several factors, including cooling inflation data, resilient consumer spending, and the anticipation of interest rate cuts by the Federal Reserve. When the market perceives that the “cost of money” is going to decrease, stock valuations—particularly those of the blue-chip companies found in the Dow—tend to rise as investors seek higher returns than those offered by fixed-income assets.
Nominal vs. Inflation-Adjusted Highs
When discussing the highest point of the Dow, it is essential to distinguish between nominal value and inflation-adjusted value. In nominal terms, the Dow is currently at its highest point in history. However, purists often argue that to understand the true “peak” of purchasing power, one must adjust for inflation. While the nominal 41,000+ level is a record, the real value of the index tells a more nuanced story about the long-term growth of American corporate earnings versus the eroding power of the dollar. For most retail investors, the nominal high remains the primary benchmark for portfolio performance and market sentiment.
The Evolution of the Dow: From 12 Companies to a Global Benchmark
To appreciate the significance of the Dow hitting 41,000, one must look back at its origins. Created by Charles Dow and Edward Jones in 1896, the index originally consisted of just 12 industrial companies, many of which were involved in railroads, cotton, gas, and tobacco. At its inception, the index stood at a mere 40.94 points.
Milestones on the Road to 40,000
The journey of the Dow is a timeline of American economic history. It took decades to reach the first major psychological milestones:
- The 1,000 Mark: The Dow first closed above 1,000 in November 1972. It had flirted with this level for years, but economic stagnation in the 1960s kept it at bay.
- The 10,000 Mark: It took another 27 years to reach 10,000, a feat accomplished in March 1999 during the height of the dot-com boom.
- The 20,000 Mark: Following the Great Recession of 2008, the Dow staged a massive recovery, finally hitting 20,000 in January 2017.
- The 30,000 Mark: Despite the global pandemic, the Dow surged to 30,000 in November 2020, fueled by unprecedented government stimulus and the rapid development of vaccines.
The Changing Composition of the Index
The reason the Dow has been able to reach such astronomical heights is its ability to evolve. The “Industrial” in its name is largely a legacy term. Today, the index includes technology leaders, healthcare providers, and financial institutions. By swapping out stagnant companies for growth-oriented leaders—such as replacing older industrial firms with the likes of Salesforce or Amazon—the Dow remains a relevant reflection of the modern economy. This constant rebalancing ensures that the index captures the highest-performing sectors of the era, pushing the “all-time high” further into the future.
Key Factors Driving the Dow to Record Levels

Record-breaking highs do not happen in a vacuum. The ascent to the current highest Dow Jones levels is the result of a “perfect storm” of economic drivers that have supported corporate profitability and investor confidence.
Corporate Earnings and Profit Margins
The most fundamental driver of the Dow is corporate earnings. Stock prices, in the long run, follow the trajectory of profits. In recent years, despite concerns over a recession, Dow components have shown remarkable resilience. Companies within the index have utilized technology to increase efficiency, managed supply chain disruptions, and maintained pricing power even in inflationary environments. When companies like Apple or JPMorgan Chase report record-breaking quarterly profits, they provide the fundamental “floor” that allows the Dow to reach new ceilings.
Monetary Policy and the Federal Reserve
The Federal Reserve’s influence on the Dow cannot be overstated. Since the 2008 financial crisis, the world has largely operated in a low-interest-rate environment. Low rates make it cheaper for companies to borrow money for expansion and share buybacks. Furthermore, when bond yields are low, investors are forced into the equity markets to find yield, driving up demand for Dow stocks. The record highs seen in 2024 are partially attributed to the market’s expectation that the Fed has successfully navigated a “soft landing”—taming inflation without triggering a massive spike in unemployment.
The Role of Institutional and Algorithmic Trading
Modern markets are increasingly dominated by institutional investors and high-frequency trading algorithms. These entities often use “all-time highs” as technical triggers. When the Dow breaks through a major resistance level—like 38,000 or 40,000—it often triggers a wave of programmatic buying. This momentum can push the index even higher, creating a feedback loop where the record high itself becomes a catalyst for further gains.
Why All-Time Highs Matter for Personal Finance and Investing
For the individual investor, news that the Dow has reached its highest point ever can be a double-edged sword. While it signals growth, it also brings a sense of trepidation about a potential market correction.
The Psychological Impact of Peaks
Psychologically, all-time highs can lead to “FOMO” (fear of missing out), causing retail investors to jump into the market at the top. Conversely, it can cause “analysis paralysis,” where investors wait for a “dip” that may not come for months or years. Understanding that the Dow spends a significant portion of its life within 5% of an all-time high is crucial for maintaining a long-term perspective. Historically, buying at an all-time high has often resulted in positive returns over a five-to-ten-year horizon because the index is designed to grow alongside the economy.
Portfolio Rebalancing and Risk Management
When the Dow is at its highest, it is an excellent time for investors to review their asset allocation. If a portfolio was originally intended to be 60% stocks and 40% bonds, a major run-up in the Dow might have pushed the equity portion to 70% or 75%. Rebalancing—selling some of the winning stocks to buy undervalued assets—allows investors to “lock in” gains from these historic highs and manage their risk exposure before the next inevitable market cycle begins.
Looking Ahead: Can the Dow Jones Reach 50,000?
With the Dow currently testing the 41,000 range, the financial world is already looking toward the next major milestone: 50,000. While it may seem like a distant target, the power of compound interest and economic expansion makes it a matter of “when,” not “if.”
The Trajectory of Compound Growth
Mathematically, the jump from 40,000 to 50,000 is a 25% increase. While that sounds substantial, the Dow has historically returned an average of roughly 7-10% per year including dividends. At a 7% growth rate, the Dow could theoretically reach 50,000 within three to four years. As the companies within the index continue to innovate—particularly in fields like Artificial Intelligence, biotechnology, and renewable energy—their valuations will likely continue to expand, dragging the price-weighted index higher.

Potential Headwinds and Market Risks
The path to the next all-time high is rarely a straight line. Geopolitical tensions, shifts in global trade, and demographic changes (such as an aging workforce) present significant risks. Additionally, if inflation proves to be “sticky,” the Federal Reserve may keep interest rates higher for longer, which could cap the valuation multiples of Dow stocks. Investors must remain cognizant that while the “highest Dow Jones” is a moving target, the journey involves periods of significant drawdown and volatility.
In conclusion, the highest Dow Jones ever recorded is a testament to the enduring strength of the American corporate sector and the global financial system. From its start at 40 points to its current heights above 41,000, the index reflects the progress of industry, technology, and human ingenuity. For the savvy investor, these record highs are not just numbers to be celebrated, but milestones in a broader strategy of long-term wealth accumulation and financial discipline. Whether the index is at 40,000 or 50,000, the principles of sound investing—diversification, consistency, and a focus on fundamentals—remain the most reliable tools for navigating the peaks and valleys of the market.
aViewFromTheCave is a participant in the Amazon Services LLC Associates Program, an affiliate advertising program designed to provide a means for sites to earn advertising fees by advertising and linking to Amazon.com. Amazon, the Amazon logo, AmazonSupply, and the AmazonSupply logo are trademarks of Amazon.com, Inc. or its affiliates. As an Amazon Associate we earn affiliate commissions from qualifying purchases.