
The cost of oil per barrel is perhaps the most significant pulse point in the global financial system. Often referred to as “black gold,” crude oil remains the primary energy source powering international trade, manufacturing, and transportation. For investors, business owners, and financial analysts, the current cost of oil is not merely a number on a ticker; it is a complex indicator of geopolitical stability, inflationary pressure, and the overall health of the global economy. Understanding what drives this price and how to interpret its fluctuations is essential for anyone navigating the modern financial landscape.
The Global Benchmarks: Decoding WTI, Brent, and the Price Spread
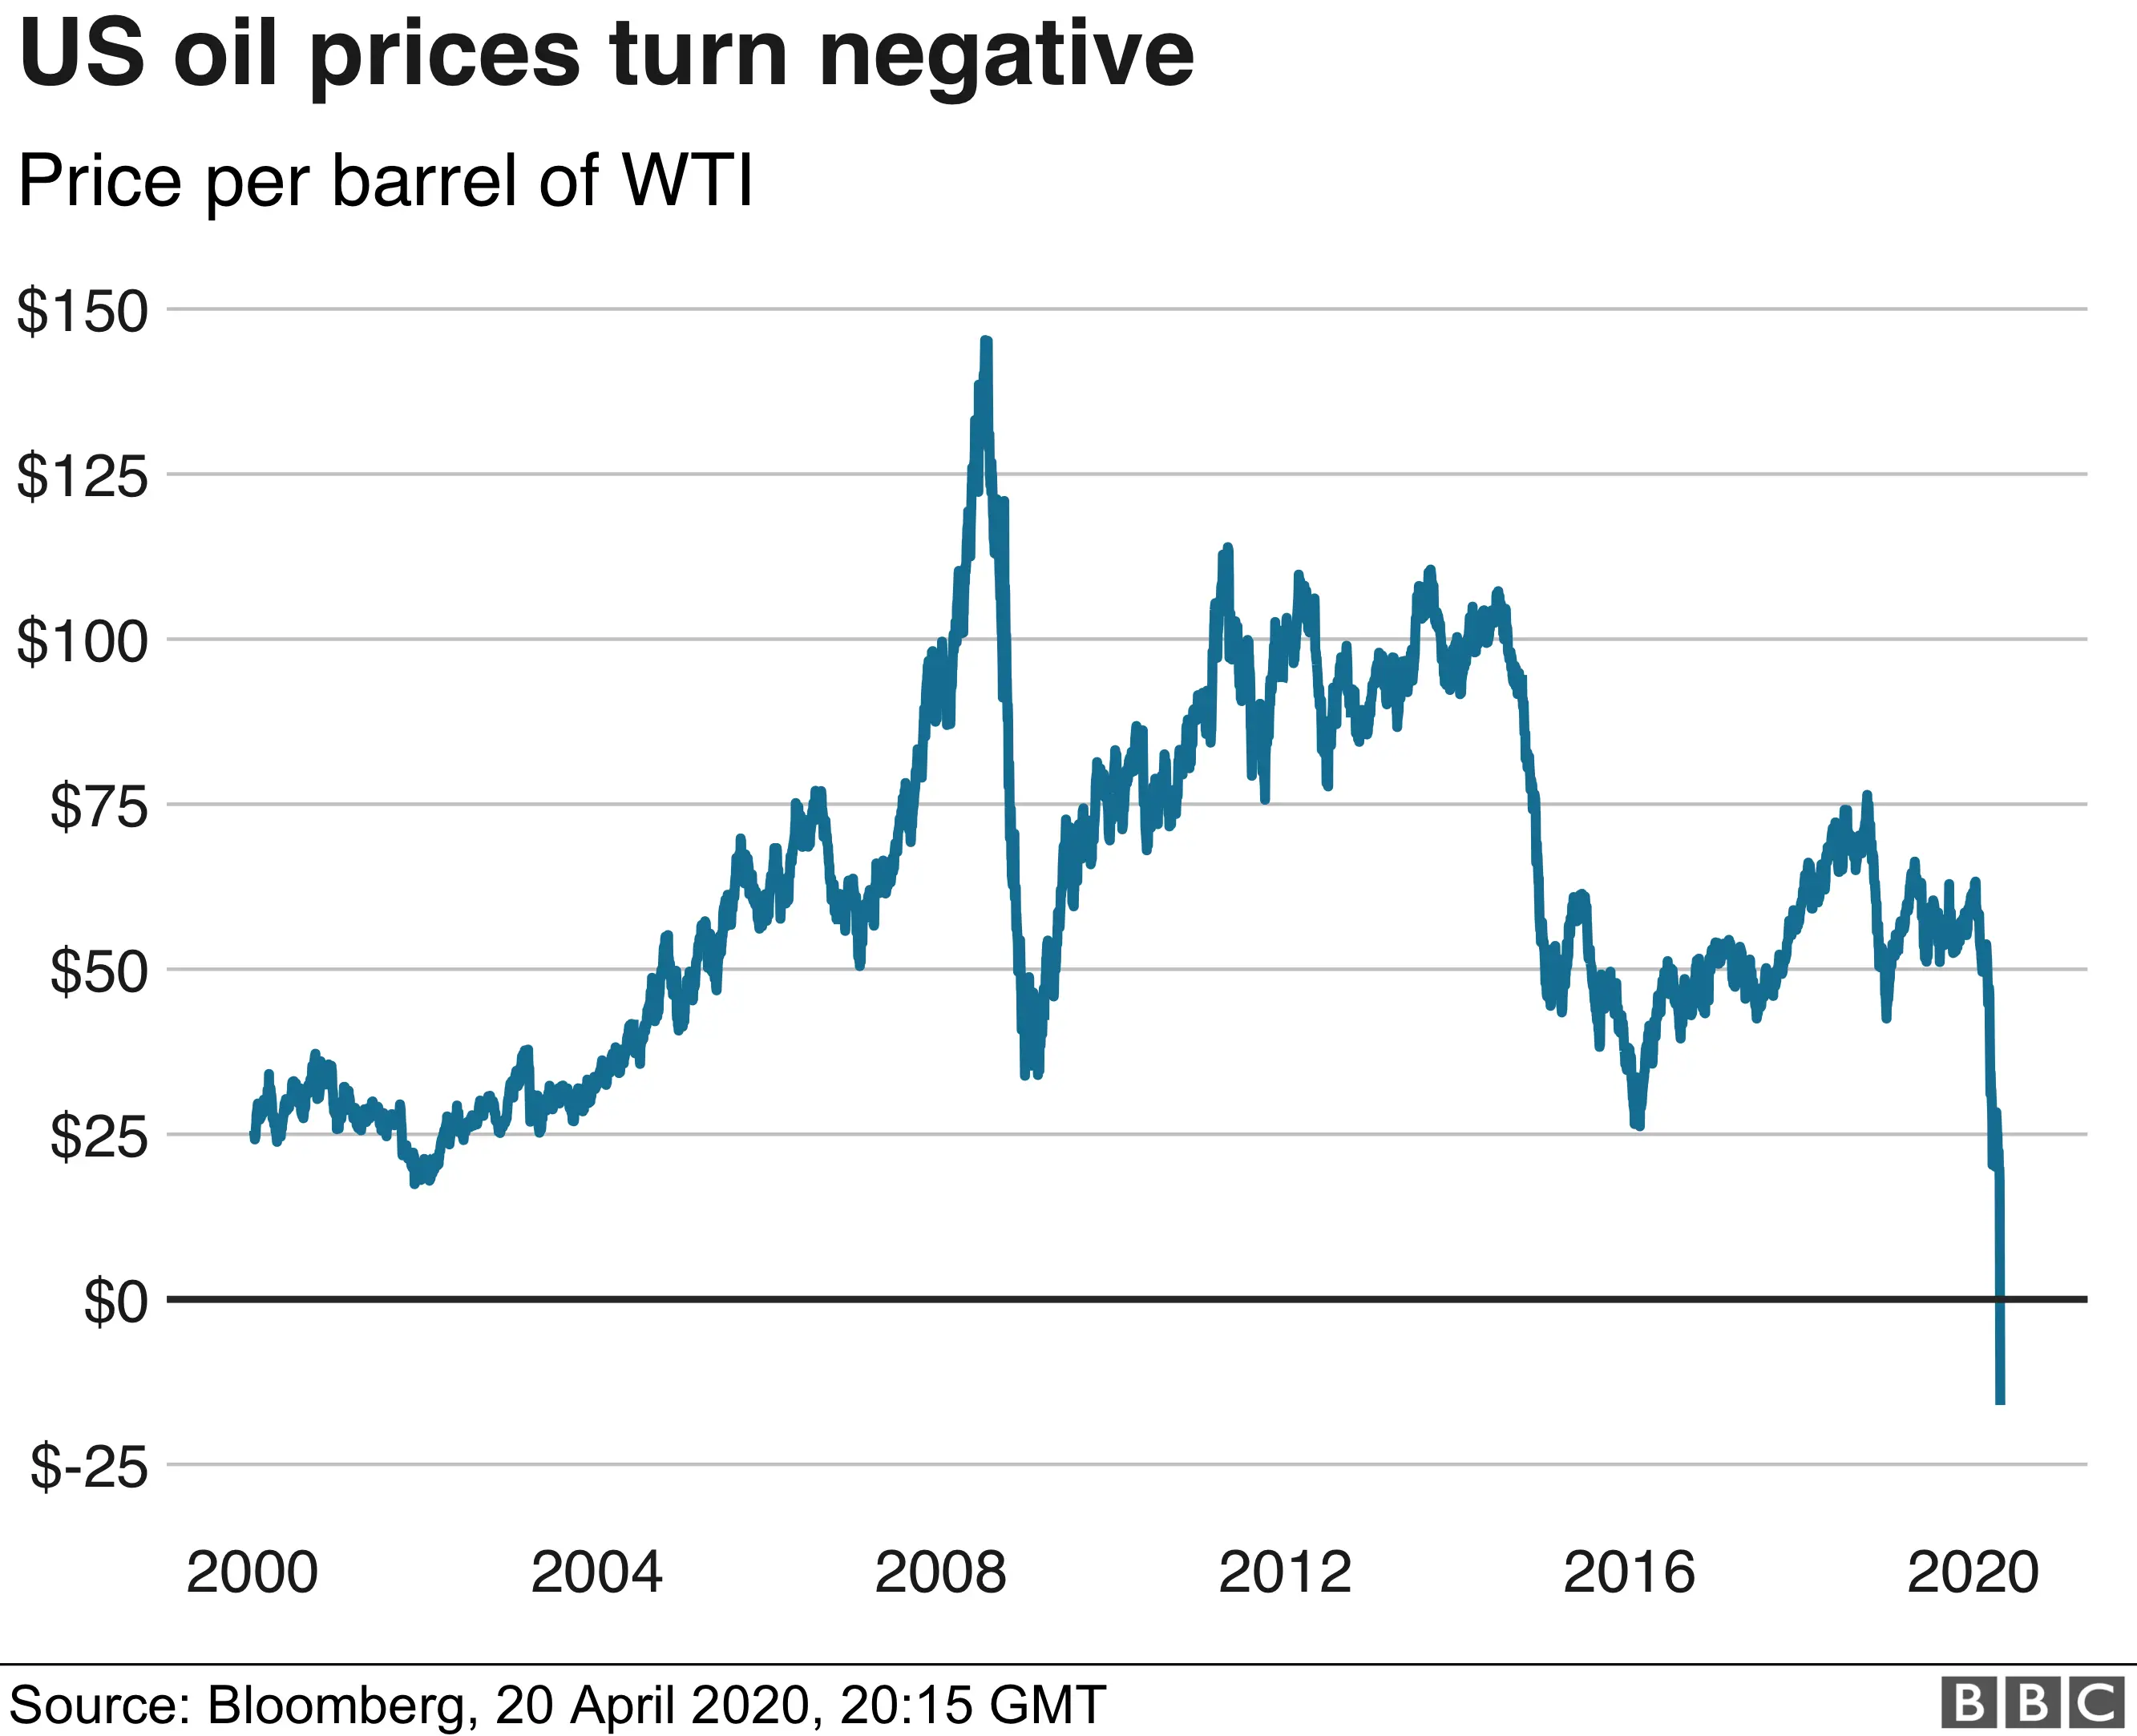
When someone asks, “What is the current cost of oil?” the answer depends entirely on which benchmark is being referenced. Oil is not a monolithic product; its price varies based on its quality, its sulfur content, and the location where it is traded. In the world of finance, two primary benchmarks dominate the conversation.
West Texas Intermediate (WTI)
WTI is the primary benchmark for oil produced in the United States, specifically from the Permian Basin and other domestic fields. It is a “light, sweet” crude, meaning it has a low density and low sulfur content. This makes it particularly efficient for refining into gasoline and diesel. WTI is traded on the New York Mercantile Exchange (NYMEX) and is the standard reference point for the American energy sector. Because it is landlocked, its price is often influenced by pipeline capacity and storage levels at the delivery hub in Cushing, Oklahoma.
Brent Crude
Brent Crude serves as the international benchmark and represents oil extracted from the North Sea. It is also a light, sweet crude, though slightly different in composition from WTI. Brent is used to price approximately two-thirds of the world’s internationally traded crude oil supplies. It is traded on the Intercontinental Exchange (ICE) in London. Because Brent is waterborne, it can be shipped easily to various global markets, making it highly sensitive to international geopolitical events and global shipping logistics.
The WTI-Brent Spread
The “spread” refers to the price difference between these two benchmarks. Historically, WTI and Brent traded at similar prices, but factors such as the U.S. shale revolution, infrastructure bottlenecks, and geopolitical tensions in the Middle East often cause them to diverge. For an investor, a widening or narrowing spread can signal shifts in global supply routes or changes in the competitiveness of U.S. exports versus international production.
Macroeconomic Catalysts: Why Oil Prices Are Never Static
The price of a barrel of oil is rarely settled for long. It is subject to a constant tug-of-war between supply and demand, influenced by a myriad of macroeconomic factors that can cause price swings of 5% or more in a single trading session.
The Role of OPEC+ and Production Quotas
The Organization of the Petroleum Exporting Countries (OPEC), led by Saudi Arabia, along with allies like Russia (collectively known as OPEC+), wields immense power over the current cost of oil. By adjusting production quotas, this cartel can intentionally create a surplus or a deficit in the market to stabilize prices or drive them higher. For the financial strategist, monitoring OPEC+ meetings is a mandatory exercise, as their decisions on “output cuts” or “unwinding production” are the single biggest movers of the crude market.
Geopolitical Risk Premiums
Oil is frequently produced in regions prone to political instability. When conflict arises in the Middle East, Eastern Europe, or North Africa, the market often applies a “risk premium” to the price of oil. This premium accounts for the potential disruption of supply lines, such as the Strait of Hormuz or major pipelines. Even if actual production is not interrupted, the mere threat of a supply shock can send prices soaring as traders hedge against future scarcity.
The Inverse Relationship with the U.S. Dollar
Because oil is priced globally in U.S. dollars (USD), there is a strong inverse relationship between the strength of the currency and the price of the commodity. When the USD strengthens, oil becomes more expensive for holders of other currencies, which typically suppresses demand and leads to lower prices. Conversely, a weakening dollar makes oil cheaper for international buyers, often driving up the price per barrel. For the business financier, managing currency risk is an inseparable part of managing energy costs.
The Financial Impact: From Corporate Balance Sheets to Personal Portfolios
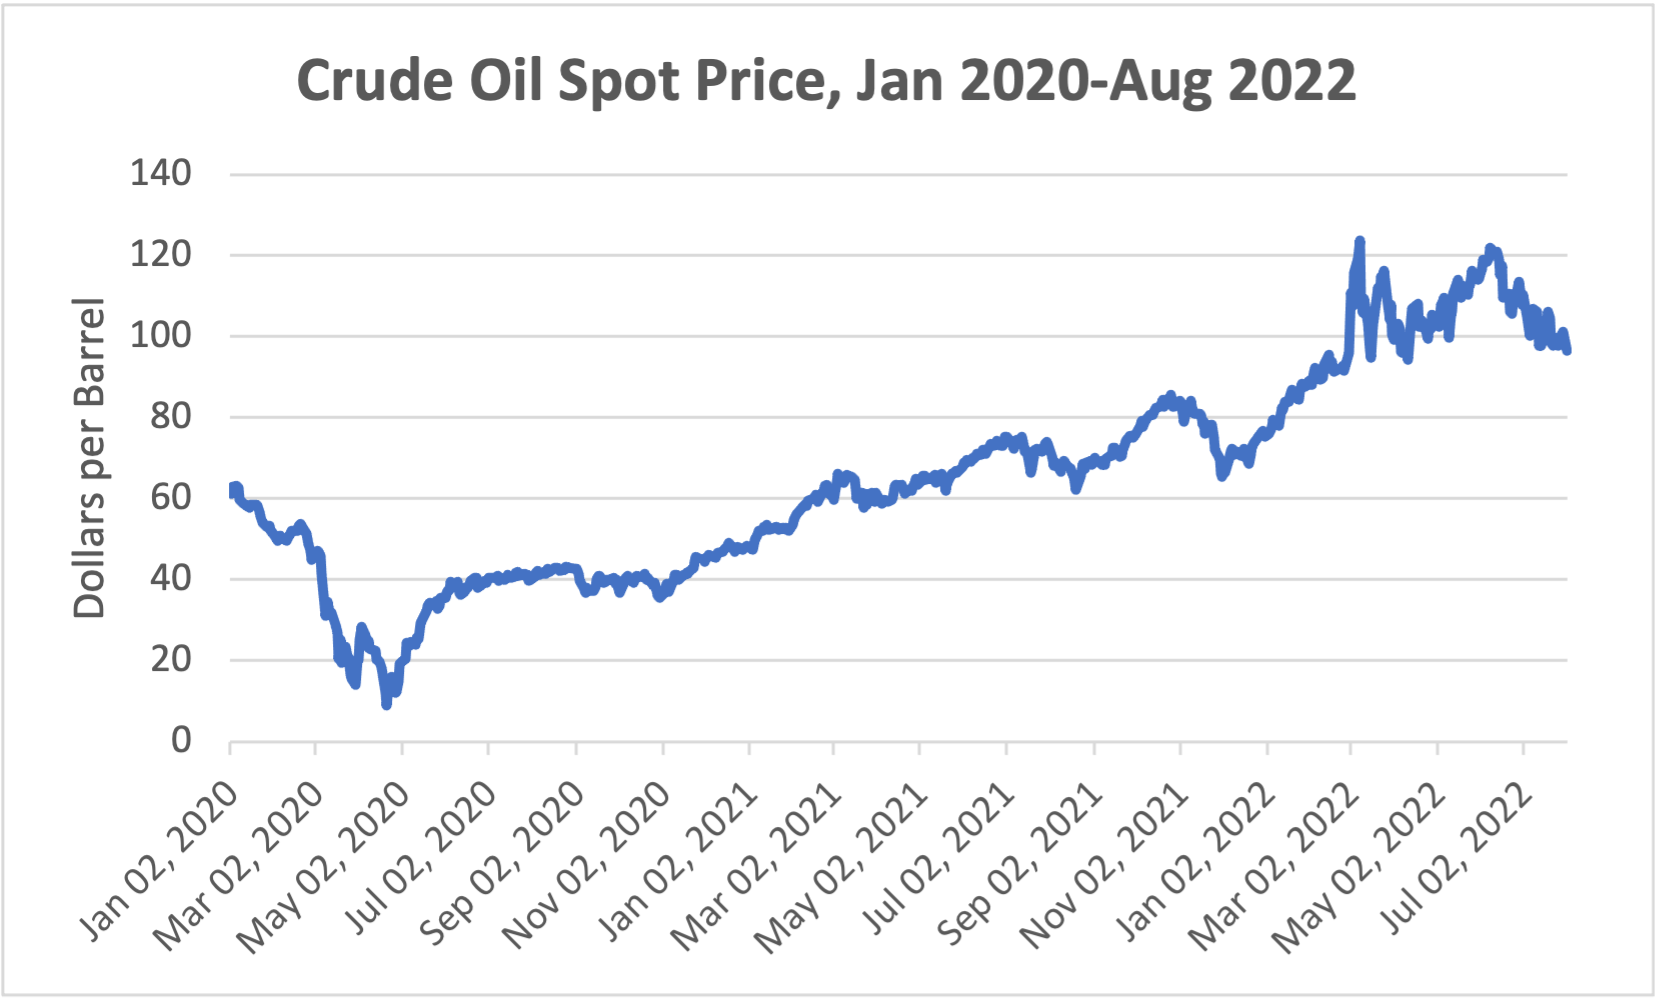
The current cost of oil per barrel reverberates through every level of the economy, affecting everything from the cost of a gallon of milk to the profitability of multinational corporations.
Inflationary Pressures and Central Bank Policy
Oil is a foundational input cost. When the price of oil rises, the cost of transporting goods increases, which is almost always passed on to the consumer. This contributes to “cost-push” inflation. Central banks, such as the Federal Reserve, keep a close watch on energy prices because persistent high oil costs can trigger inflation that necessitates higher interest rates. Investors must recognize that high oil prices often lead to a “hawkish” monetary environment, which can be a headwind for the broader stock market.
Impact on the Transportation and Manufacturing Sectors
For industries like airlines, logistics, and heavy manufacturing, oil is one of the largest line-item expenses. A sustained increase in the cost per barrel can decimate the margins of a commercial carrier or a shipping giant. Conversely, when oil prices drop, these sectors often experience a “windfall” of profitability. Analyzing the sensitivity of a company’s balance sheet to energy prices is a critical component of fundamental equity analysis.
Consumer Spending and the “Tax” on the Public
From a personal finance perspective, high oil prices act as a regressive tax. As more of the household budget is diverted to fuel and heating, discretionary spending on retail, travel, and entertainment tends to decline. For the retail investor, this means that a spike in oil prices is often a precursor to a slowdown in consumer-facing sectors.
Navigating the Market: How to Invest and Hedge Against Volatility
There are multiple ways for individuals and institutions to gain exposure to the price of oil, ranging from direct commodity trading to indirect equity investments.
Direct Exposure: Futures and Options
For sophisticated traders, the futures market allows for direct speculation on the price of WTI or Brent. By entering into a contract to buy or sell oil at a specific price on a future date, traders can profit from price movements. However, this is a high-leverage environment and is generally reserved for institutional players or experienced individual traders. Options on futures provide another layer of strategy, allowing for “hedging”—protecting a portfolio against a sudden price drop.
Energy Stocks and ETFs
The most common way for the average investor to interact with oil prices is through the equity market. This includes “Supermajors” like ExxonMobil, Chevron, and Shell. These companies are vertically integrated, meaning they handle everything from extraction (upstream) to refining and retail (downstream). Additionally, Exchange-Traded Funds (ETFs) like the Energy Select Sector SPDR Fund (XLE) allow investors to buy a basket of energy stocks, providing diversified exposure to the sector without the risk associated with a single company.
Understanding Contango and Backwardation
Investors in oil-linked financial products must understand the structure of the “forward curve.”
- Contango occurs when the future price of oil is higher than the current spot price. This usually happens when the market is oversupplied and storage costs are high.
- Backwardation occurs when the future price is lower than the spot price, indicating a current shortage or high immediate demand.
For an investor holding an oil ETF that “rolls” its contracts every month, being in a state of contango can lead to “roll yield” losses, even if the spot price of oil remains flat.
Forecasting the Future: Technology, Transition, and Long-Term Value
While the current cost of oil is dictated by immediate supply and demand, its long-term value is being reshaped by technological advancements and the global transition toward renewable energy.
The Impact of U.S. Shale Technology
The development of hydraulic fracturing (fracking) and horizontal drilling has turned the United States into one of the world’s top oil producers. This has created a “ceiling” on oil prices; whenever prices rise high enough to make shale extraction profitable, U.S. producers increase output, which eventually brings prices back down. This technological elasticity has fundamentally changed the volatility profile of the oil market.
The Green Energy Transition and Peak Oil Demand
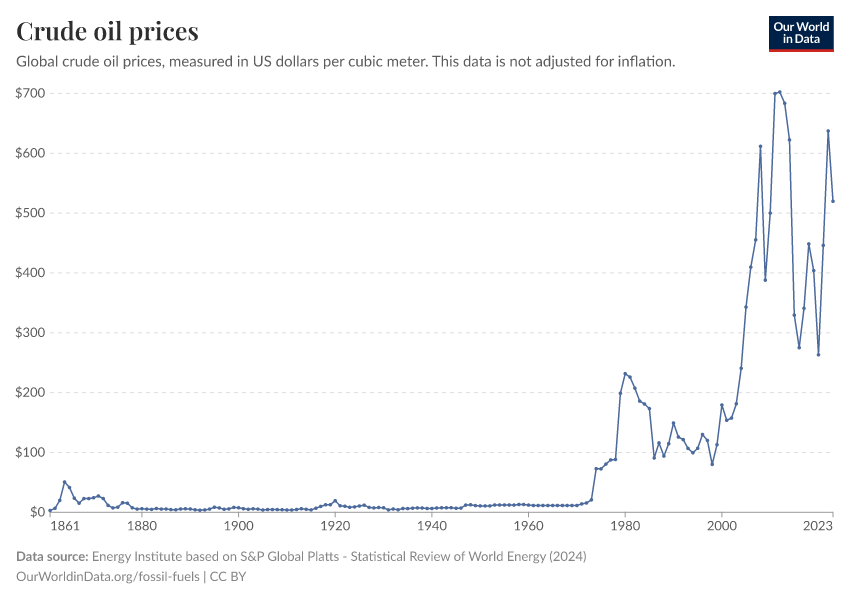
The global push toward Environmental, Social, and Governance (ESG) standards and the rise of electric vehicles (EVs) have led many analysts to debate when “peak oil demand” will occur. As economies diversify away from fossil fuels, the long-term price trajectory of oil may face downward pressure. However, underinvestment in new oil exploration during the transition period could also lead to supply shortages, causing dramatic price spikes in the short to medium term.
Using Data Tools for Real-Time Analysis
To stay informed on the current cost of oil, financial professionals rely on specific data sets. The Energy Information Administration (EIA) releases a weekly report on U.S. crude inventories every Wednesday. This report is a “market-moving” event; if inventories are lower than expected, it suggests strong demand and usually drives prices up. Real-time terminals like Bloomberg or specialized commodity platforms are essential for those managing significant capital within the energy space.
The cost of oil per barrel is more than just a commodity price; it is a vital economic signal. By understanding the benchmarks of WTI and Brent, monitoring the moves of OPEC+, and recognizing the broader macroeconomic implications, investors and business leaders can better position themselves to thrive in a market where energy remains the ultimate currency of progress.
aViewFromTheCave is a participant in the Amazon Services LLC Associates Program, an affiliate advertising program designed to provide a means for sites to earn advertising fees by advertising and linking to Amazon.com. Amazon, the Amazon logo, AmazonSupply, and the AmazonSupply logo are trademarks of Amazon.com, Inc. or its affiliates. As an Amazon Associate we earn affiliate commissions from qualifying purchases.