In the world of finance, numbers are the primary language of success. Whether you are tracking the growth of a retirement portfolio, analyzing the volatility of a tech stock, or managing the overhead costs of a scaling business, understanding the magnitude of change is essential. While raw numbers provide the “what,” percentages provide the “how much” in a way that allows for meaningful comparison. Learning how to find the percentage difference is not merely a mathematical exercise; it is a fundamental skill for anyone looking to master their personal finances, optimize investments, or steer a corporate budget toward profitability.

The ability to calculate and interpret percentage differences allows investors and financial managers to strip away the noise of large figures and focus on relative performance. This guide explores the application of percentage difference within the “Money” niche, providing you with the formulas, contexts, and strategic insights needed to leverage this metric for better financial decision-making.
1. The Mathematical Foundation: Understanding the Formula in a Financial Context
Before applying the concept to complex portfolios, one must master the basic mechanics. In financial terms, we often alternate between “percentage difference” and “percentage change.” While they are mathematically similar, their applications in money management differ slightly.
The Standard Percentage Change Formula
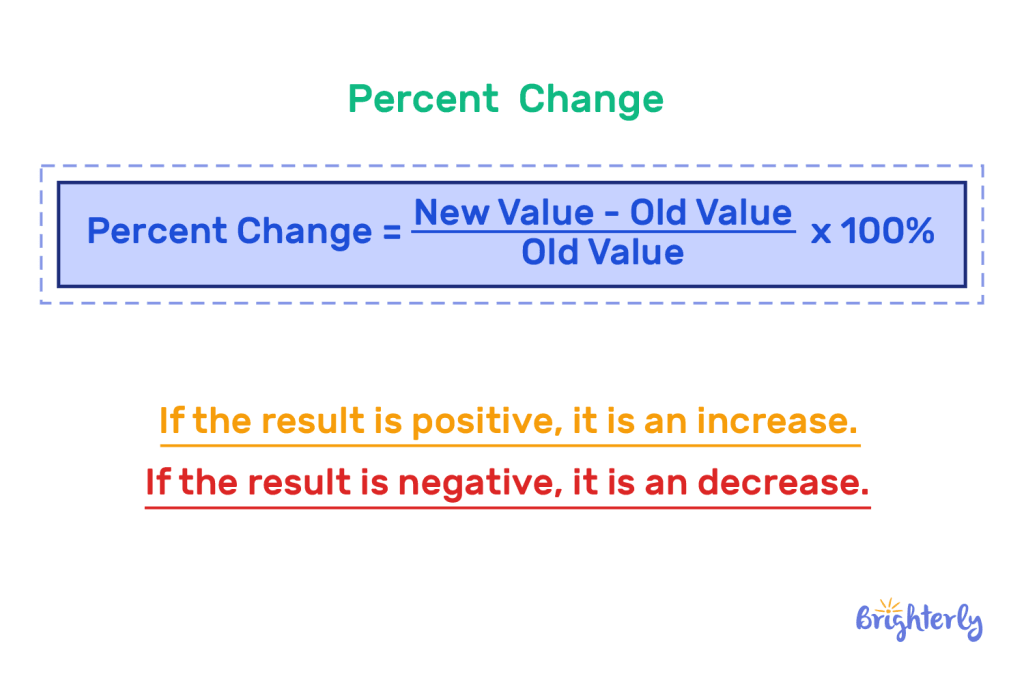
In most financial scenarios—such as tracking a stock price from Monday to Friday—we use the percentage change formula. This measures the growth or decline of a single asset over time:
Formula: [(New Value – Old Value) / |Old Value|] × 100
If your shares in an Index Fund rose from $150 to $165, the calculation would be:
($165 – $150) / $150 = 0.10. Multiplying by 100 gives you a 10% increase.
Percentage Difference Between Two Independent Figures
The “percentage difference” specifically is used when comparing two different items that are of the same category, such as the interest rates of two different high-yield savings accounts.
Formula: [|Value A – Value B| / ((Value A + Value B) / 2)] × 100
This is used when there is no “old” or “new” value, but rather a comparison of two concurrent options. Understanding which formula to use ensures that your financial reporting remains accurate and that you aren’t misrepresenting your gains or losses.
Avoiding Common Pitfalls in Financial Calculations
A common mistake in financial analysis is confusing “percentage points” with “percentages.” If a mortgage rate increases from 3% to 4%, it has increased by one percentage point, but the percentage difference (or change) is actually 33.3%. Failing to make this distinction can lead to significant errors in budgeting and long-term interest projections.
2. Percentage Difference in Personal Finance and Strategic Budgeting
For the individual looking to achieve financial independence, the percentage difference is a vital metric for auditing lifestyle creep and optimizing savings.
Benchmarking Monthly Expenses
A common strategy in professional financial planning is the “Month-over-Month” (MoM) analysis. By calculating the percentage difference in your discretionary spending—such as dining out or entertainment—you can identify patterns that raw dollar amounts might hide. For instance, a $50 increase in a $200 grocery bill (25% increase) is far more significant than a $50 increase in a $2,000 rent payment (2.5% increase).
Evaluating Insurance and Service Premiums
When your annual car insurance or health insurance premium comes up for renewal, companies often nudge the price upward. By calculating the percentage difference between last year’s premium and the new quote, you can decide if the increase justifies the effort of shopping for a new provider. Generally, a difference of more than 5-10% in a stable market is a signal to seek competitive quotes.
Optimizing the Savings Rate
The most important number in personal finance is often cited as the “savings rate”—the percentage of your income that remains after expenses. By tracking the percentage difference in your savings rate year-over-year, you can measure your progress toward retirement. If your income increases by 10% but your savings rate decreases by 5%, the percentage difference reveals that your “lifestyle inflation” is outstripping your earnings growth.
3. Analyzing Investment Performance and Market Volatility
In the realm of investing, the percentage difference is the ultimate equalizer. It allows an investor to compare a $50,000 investment in a blue-chip stock with a $5,000 investment in a startup on a level playing field.
Measuring Return on Investment (ROI)
ROI is essentially a percentage difference calculation applied to capital. Professional investors use this to determine the efficiency of different asset classes. If your real estate holding increased in value by 8% this year, while your equity portfolio increased by 12%, the percentage difference in their performance suggests a need to rebalance your portfolio toward the more productive asset, depending on your risk tolerance.
Comparing Assets to Benchmarks
To know if a fund manager or a specific stock is “good,” you must compare it to a benchmark, such as the S&P 500. If the S&P 500 returns 10% in a year and your personal portfolio returns 7%, the percentage difference between your return and the market return is a critical indicator of your strategy’s underperformance. This “alpha” (the excess return relative to a benchmark) is almost always expressed and calculated through percentage comparisons.
Understanding Dividend Yield Changes
For income-focused investors, the percentage difference in dividend yields is paramount. When a company increases its dividend from $0.50 per share to $0.55 per share, that 10% increase can significantly impact the long-term compounding of a “Dividend Growth” portfolio. Calculating these differences helps investors identify companies that are not just profitable, but are increasing the rate at which they return value to shareholders.
4. Business Finance: Profitability, Margins, and Scale
For business owners and corporate financial officers (CFOs), finding the percentage difference is a daily necessity for maintaining fiscal health and operational efficiency.
Gross and Net Profit Margin Analysis
A business may see its revenue grow by 20% (the percentage difference in top-line growth), but if its expenses also grow by 25%, the business is actually becoming less profitable. By calculating the percentage difference in profit margins over different fiscal quarters, leadership can identify “leakage” in the supply chain or inefficiencies in labor costs.
Year-over-Year (YoY) Growth Metrics
In business finance, YoY growth is the gold standard for measuring success. This involves finding the percentage difference between the current year’s performance and the previous year’s. This metric smooths out seasonal fluctuations—such as a retail business performing better in December than in July—by comparing the same periods in different years.
Customer Acquisition Cost (CAC) vs. Lifetime Value (LTV)
In the modern digital economy, businesses live and die by the relationship between what it costs to get a customer and how much that customer spends. Tracking the percentage difference in CAC over time is vital. If your marketing spend results in a 15% increase in CAC without a corresponding 15% increase in LTV, the business model may be heading toward a sustainability crisis.
5. Utilizing Financial Tools for Percentage Calculations
While the manual formula is essential for understanding the logic, the modern financial landscape offers various tools to automate these calculations, ensuring speed and accuracy in high-stakes environments.
Leveraging Excel and Google Sheets
For most financial professionals, spreadsheets are the primary environment for calculating percentage differences.
- The Formula: If cell A1 is the old price and B1 is the new price, the formula
=(B1-A1)/A1formatted as a percentage will give you the instant result. - Conditional Formatting: You can set your spreadsheet to automatically turn cells red if the percentage difference represents a loss of more than 5%, or green if it represents a gain, allowing for instant visual auditing of large data sets.
Financial Calculators and AI Tools
There are numerous dedicated financial calculators online specifically designed to find the percentage difference in CAGR (Compound Annual Growth Rate), inflation adjustments, and loan interest comparisons. Furthermore, AI-driven financial tools can now ingest bank statements or brokerage exports to automatically highlight the largest percentage differences in your spending or investment patterns, providing “insight-as-a-service.”
The Importance of Context in Financial Reporting
A 50% increase in a penny stock might represent a gain of only a few dollars, whereas a 2% increase in a multi-billion dollar pension fund represents millions. When using tools to find percentage differences, always keep the “nominal value” (the actual dollar amount) in mind. The most sophisticated financial minds look at the percentage difference to understand the trend, but look at the absolute dollar difference to understand the impact.

Conclusion
Mastering how to find the percentage difference is a transformative step in one’s financial journey. In personal finance, it acts as a diagnostic tool for spending and saving. In investing, it serves as a yardstick for performance and risk. In business, it is the heartbeat of growth and operational health. By looking past raw numbers and focusing on the relative change, you gain a clearer, more professional perspective on your wealth, enabling you to make data-driven decisions that lead to long-term financial prosperity.
aViewFromTheCave is a participant in the Amazon Services LLC Associates Program, an affiliate advertising program designed to provide a means for sites to earn advertising fees by advertising and linking to Amazon.com. Amazon, the Amazon logo, AmazonSupply, and the AmazonSupply logo are trademarks of Amazon.com, Inc. or its affiliates. As an Amazon Associate we earn affiliate commissions from qualifying purchases.